Fast Domain Reloads in Unity
Whenever you make a change in a Unity project, the Editor will freeze while it swaps in your new code. This process is called a Domain Reload. While it only takes a few seconds in an small project, domain reloads are the bane of all large Unity projects. As a project grows, reloads can take 10 seconds, 20 seconds, and sometimes minutes.
But this doesn’t have to be the case. As an engineer, you have more control over your domain reload times than you might think. Most projects should be able to achieve a 5 second reload time, almost regardless of overall size.
So let’s dig into this a bit, deeper than we usually go. What are the main components of the Domain Reload, and how can we achieve those golden 5 second iteration times?
The Anatomy of a Domain Reload
There are a few main phases to code compilation:
Find and import C# file changes.
Compile C# code.
Swap the AppDomain.
Run InitializeOnLoad callbacks.
A long domain reload is almost always a symptom of a problem in one of these phases. Let’s look at each of these individually.
1. Importing C# File Changes
As the number of files in a project grows, Unity spends more and more time scanning those files for changes. The time spent in this step is grows with respect to the number of files in the project.
Luckily, Unity has been working on this problem. In the latest Unity 2020.1 there is a new option: Preferences > General > Directory Monitoring. Checking this box will cause Unity to watch for new changes using the underlying OS APIs, rather than scanning the entire Assets folder for updated files.
With this feature, asset scanning times should drop to nearly zero.
2. C# Compilation
Once Unity knows which files have changed, it must compile the assembly for the changed files, as well as recompile any code that depends on those assemblies. This can take a long time if your change causes a large percentage of the code to be recompiled.
This is where the value of .asmdef files really comes into play. You should architect your project such that most code changes happen in Assemblies with few dependencies. This can be tricky, but there is some low hanging fruit:
Create a
Coreassembly, and place gameplay code in a few different leaf-node assemblies, each depending onCore.Make sure installed assets and plugins are in a separate folder (ie. the Plugins folder).
Doing this correctly, most code changes should only touch a few assemblies, and the code compilation should take no more than 1-2 seconds.
There are a few tools to help debug this step. For instance, Compilation Time Visualizer.
3. Swap the AppDomain
This is the big one, and the most opaque. Unity doesn’t do a great job of documenting what actually happens during a Domain Reload. However, they have released a fantastic profiling tool, the Editor Iteration Profiler. Using this we can dig in a bit, to see what is actually taking so long.
As it turns out, the AppDomain.Unload and AppDomain.Load calls are not the problem. Those are fairly fast — on the order of hundreds of milliseconds. The majority of the time in this phase is actually spent saving and restoring managed objects.
What does that mean? All C# objects (classes, structs, etc) are tied to an AppDomain that created them. When Unity reloads the AppDomain, those old objects are permanently destroyed. So to maintain the state of the Editor process, Unity finds all UnityEngine.Object or [Serializable] objects that are currently alive, serializes them, and restores them after the AppDomain has been swapped.
This serialization can take ages. And worse, it is linear with the number of objects currently alive in the Editor process. This explains why Domain Reload times tend to grow as the Editor stays open: as more objects are created, Unity must save/load more state.
As a project grows, we need to keep a close watch on the total memory footprint of objects in the Editor. Luckily, the Unity tools team is at it again. There is the Memory Profiler package, which lets us do just that. Here’s what a capture of a recent project looks like:
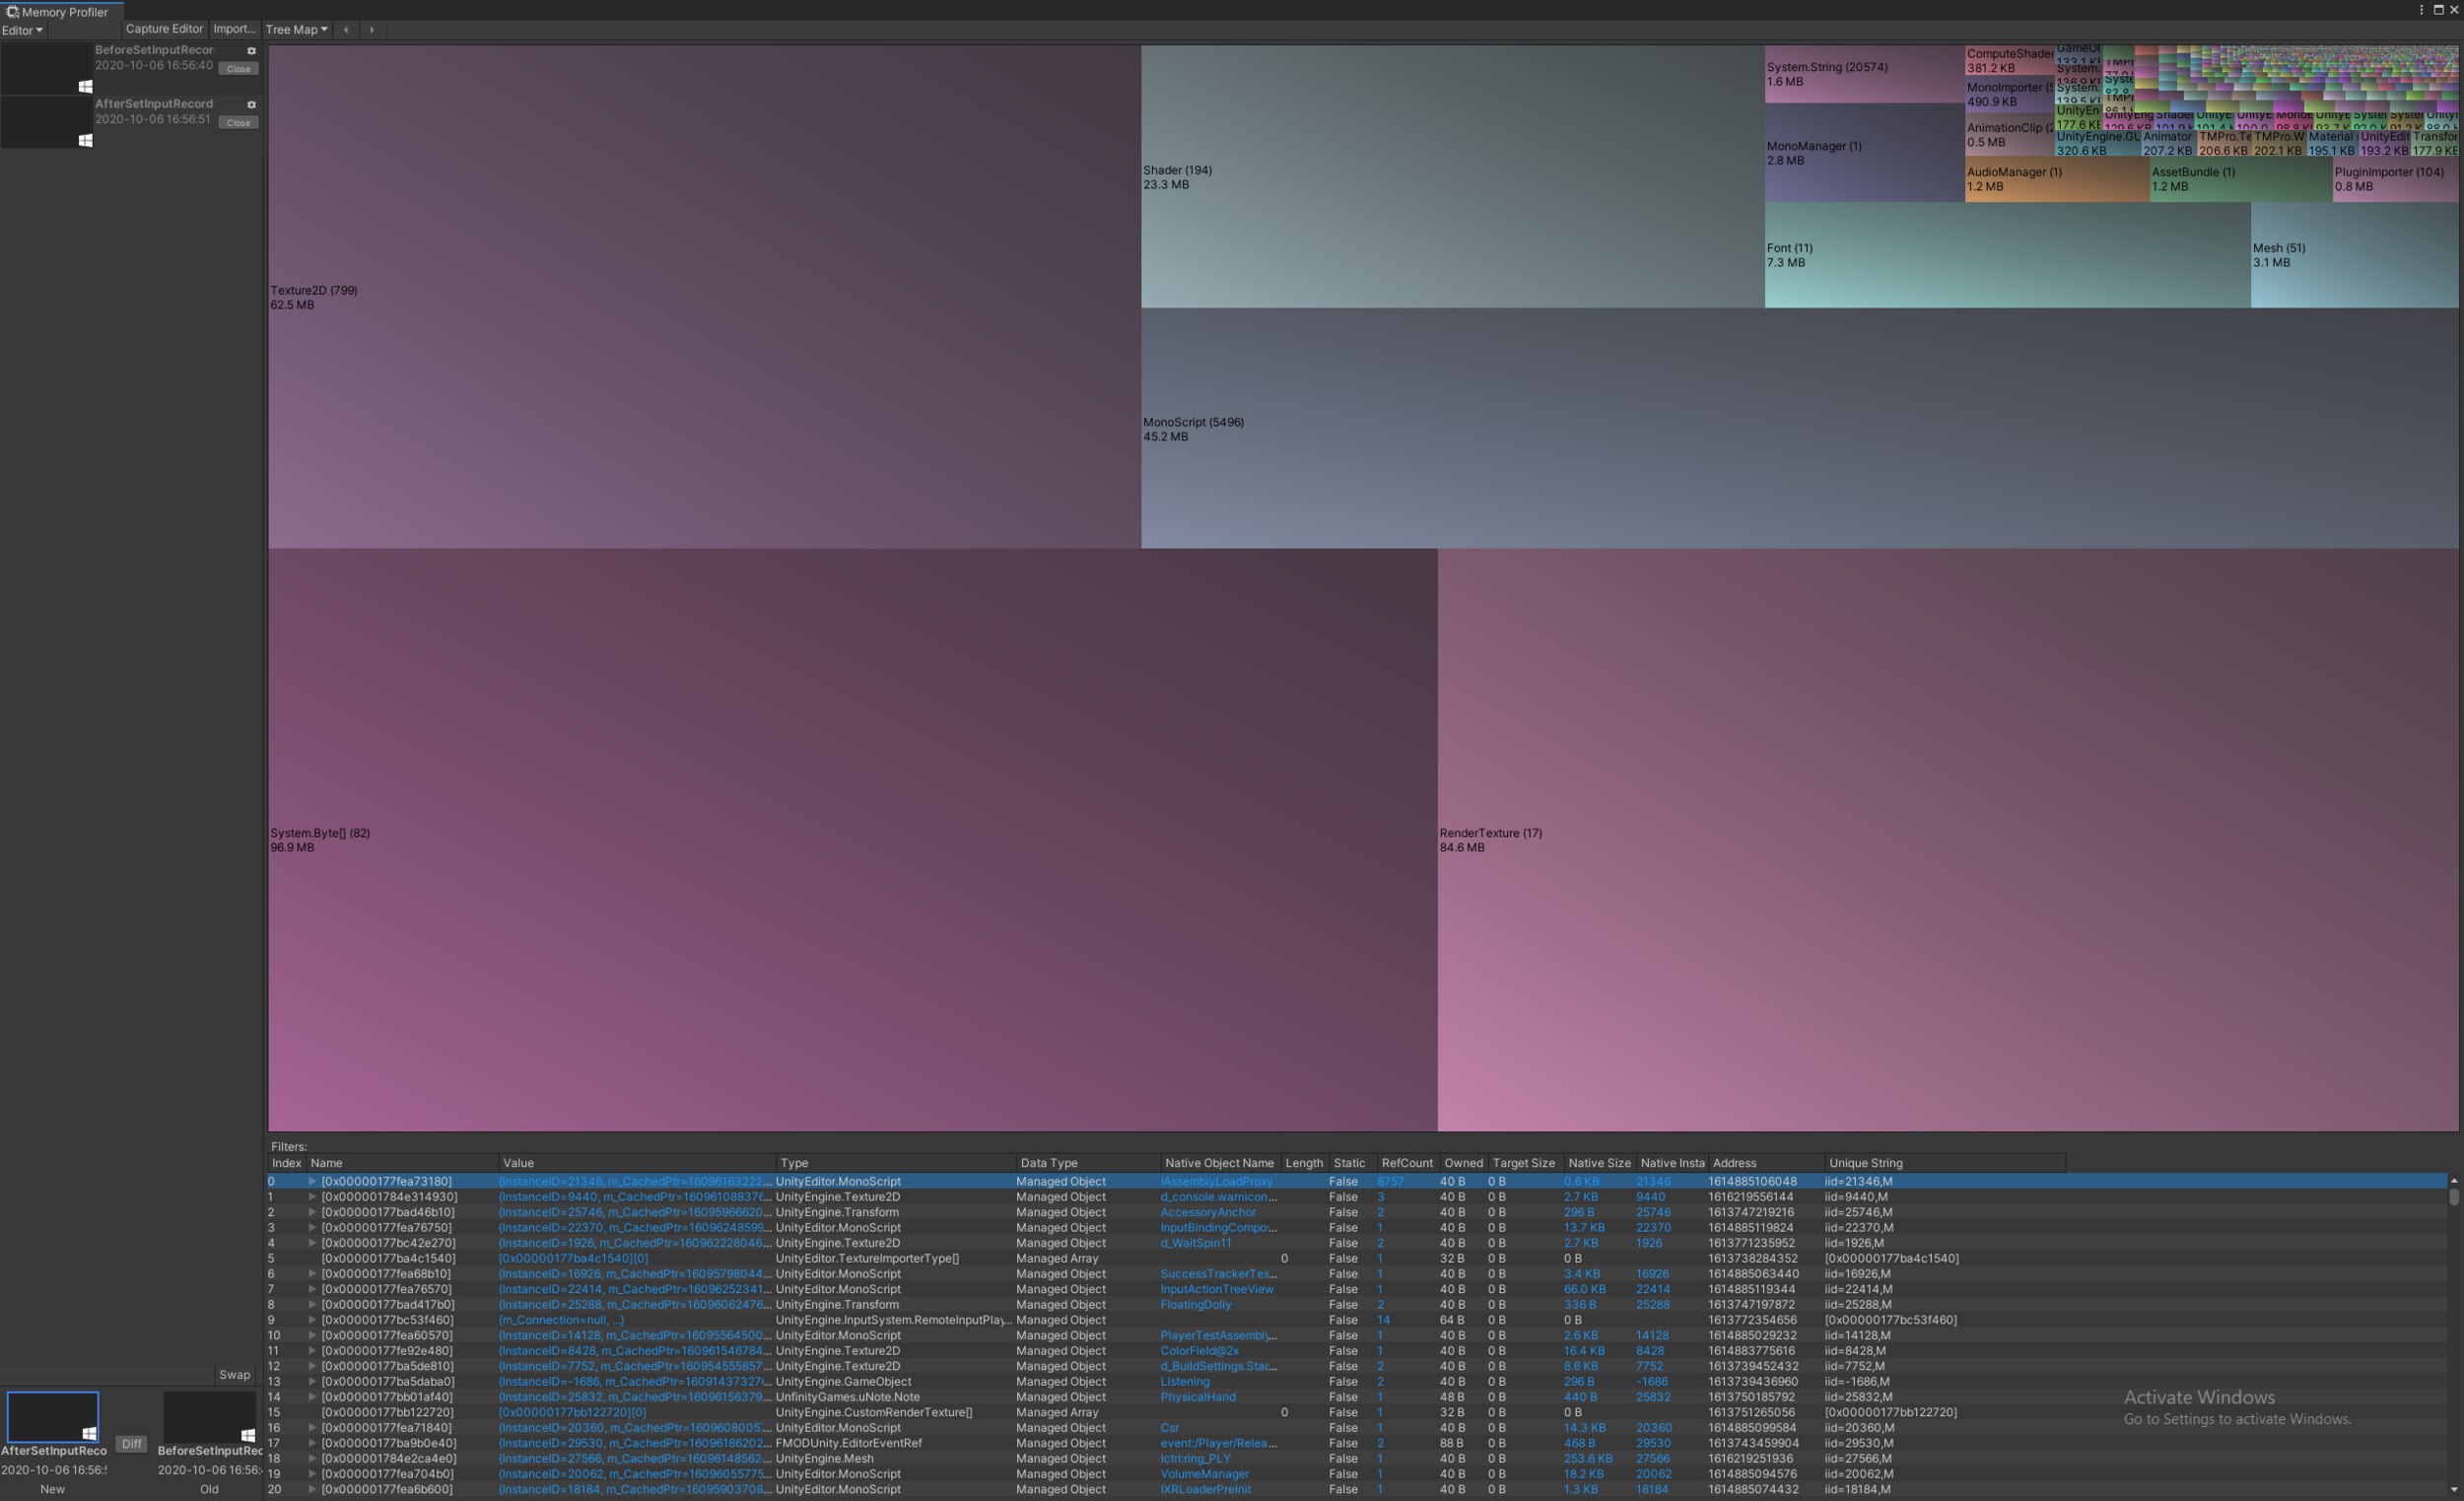
This is a treemap visualization of all managed C# objects in the current AppDomain. Notice the 96mb byte[] array. In this case, serializing this one byte array was adding 1-2 seconds of time to the domain reload! This array was being generated by a custom importer for a large asset file.
Memory Profiler also lets you diff between two snapshots. It’s a great idea to take regular snapshots, to keep track of how the memory footprint of your project grows over time, or in different scenes.
There is low hanging fruit here:
Avoid large, serializable data in Unity Objects.
Assets objects are loaded lazily, as they are needed (ex: clicking an asset in the project window). A few careful calls to
AssetDatabase.UnloadUnusedAssetscan reduce the total memory footprint dramatically.Avoid heavy calls in OnAfterDeserialize/OnBeforeSerialize, as well as in constructors and functions like
Awake(if an object is ExecuteInEditMode). These methods are called during serialization, and run during Domain Reload for all Objects.Try to limit the overall size of scenes. All objects and scripts a scene depends on will contribute to your memory footprint. Splitting up scenes can reduce this.
Keep windows closed, unless you need them! There’s no need to have objects from those windows floating around, taking up serialization time.
You don’t need to worry about asset size. Native assets like textures, models, audio, or any other data that is stored in the native layer (ie. the C++ core of Unity) do not get serialized during this phase. What matters is the size of the C# classes.
At the end of the day, this step is likely going to take a second or two. But at least it can be lowered with a bit of careful work.
4. Run InitializeOnLoad Callbacks
After a domain reload, Unity calls all functions tagged with [InitializeOnLoad]. This is the phase that most people have already optimized, but can still take a bit of time. The best you can do here is either optimize these functions, or remove them. A few notable examples:
The new Unity Input System takes ~800ms to reload and recreate input devices.
Empty folder scanners (like Maintainer) can take ~350ms to scan the Assets directory.
Packages for editors like Rider and Visual Studio often take a bit of time to regenerate solution files.
There’s already a good amount of information on this phase, so I won’t cover it more.
Bonus: Miscellaneous Operations
There’s a few other tasks that Unity does when reloading the domain. Most are small, but they can add up:
Unity immediately repaints the Editor UI after reload. Normally this is pretty fast (~200ms), but if you have complicated editor windows, this could be a bottleneck.
Unity calls the constructors for EditorWindow windows. Keep heavy code out of here.
Unity calls OnPostProcessAllAssets (for the changed C# files).
Unity regenerates the TypeCache. This takes ~300ms, depending on number of types in your assemblies. (Using this class saves time in the long run, however)
Conclusion
Long iteration times are brutal, and tricky to diagnose. But, don’t despair! Profile it! In a recent large project, we were able to reduce iteration times from ~12 seconds, all the way down to 5 seconds. You don’t have to live with it!
Happy to answer questions: reach out on Twitter, or post a comment below.